Credit Card Debt Statistics:
The 2026 Report
An analysis of the $1.13 trillion credit card debt crisis, sourced from the Federal Reserve and CFPB. See where you stand — and how to change it.
Total U.S. Credit Card Debt
Average Household Balance
Average Credit Card APR
Total Delinquency Rate
The $1.13 Trillion Milestone
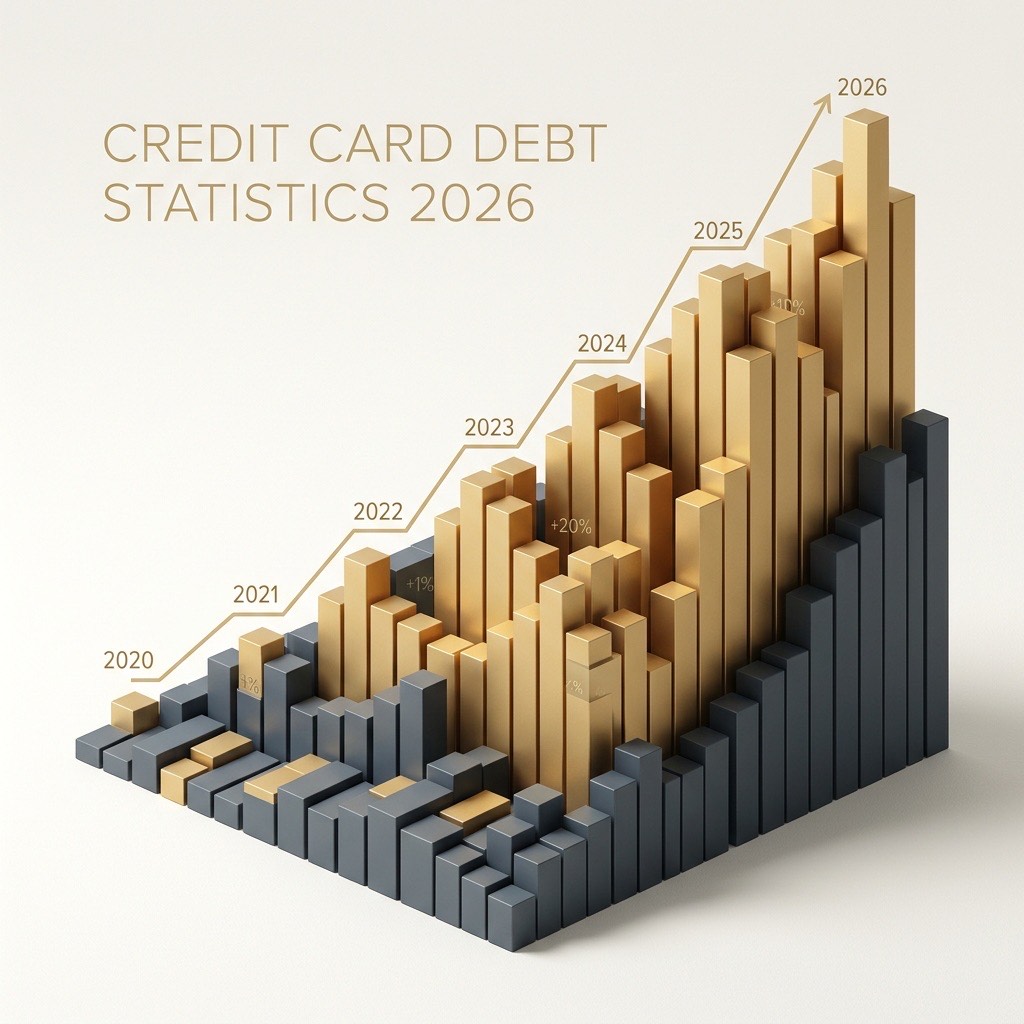
As of Q1 2026, American credit card debt has reached a new historic peak. Driven by persistent inflation and high interest rates, total balances have grown by over $100 billion in the last 12 months alone.
The APR Trap
With average APRs now exceeding 22%, the "cost of carrying" debt has never been higher. A household with the average $6,500 balance now pays over $1,400 per year in interest alone, even if they never spend another dollar.
Credit Card Debt by Age Group
Debt is not evenly distributed across generations. Gen X (ages 44–59) carries the heaviest average balances — approximately $9,100 per household — driven by peak earning years that coincide with peak spending obligations: mortgages, college tuition, and family expenses that often land on revolving credit. Millennials (28–43) average around $6,500, a figure that has grown sharply since 2022 as housing costs pushed more discretionary spending onto cards. Gen Z (18–27) enters the data with an average of $2,900 — already the fastest-growing segment, with delinquency rates rising three times faster than any other age group. Baby Boomers (60–78) carry approximately $6,200, often on fixed incomes where high APRs are most dangerous because there's limited ability to accelerate payoff. The pattern is consistent: the groups least able to absorb high interest costs are carrying the most of it.
The Minimum Payment Trap: How Long Does It Really Take?
The minimum payment is designed to maximize bank revenue, not help you get out of debt. On a $6,500 balance at 22.75% APR, the typical minimum payment of around $130/month pays off the debt in approximately 9 years and 4 months — at a total cost of $14,600. You pay more than double what you borrowed. Increase that payment by $100 to $230/month and the timeline collapses to 3 years 2 months, total cost $8,800. The extra $100/month saves you $5,800 and over 6 years of payments. This nonlinear relationship — small payment increases produce disproportionately large time and interest savings — is the core insight behind debt payoff optimization. Most people don't run this math because the tools available to them don't show it clearly. That's the problem Visentor was built to solve.
Credit Card Delinquency Rates in 2026
The 90-day delinquency rate on credit cards reached 8.9% in Q1 2026 — the highest level since the post-2008 recovery period and a full 3 points above the 2019 pre-pandemic baseline. The Federal Reserve Bank of New York's consumer credit panel shows the sharpest deterioration among cardholders aged 18–29 and 30–39, and disproportionately in households earning under $50,000/year. Critically, delinquency is a lagging indicator: by the time a balance is 90 days past due, months of high-interest accrual have already compounded the damage. The uptick in delinquencies reflects the toll of 22%+ APRs on households that were already stretched thin after three years of elevated inflation. Once a card goes delinquent, the issuer typically applies a penalty APR — often 29.99% — making recovery significantly harder.
Credit Card Debt by State
Credit card debt varies significantly by geography, reflecting differences in cost of living, median income, and regional economic conditions. Alaska, Connecticut, and New Jersey consistently rank among the highest average balances per cardholder — all three states have high costs of living and large commuter populations where credit cards substitute for liquidity. States in the Deep South — Mississippi, Alabama, and Arkansas — tend to show lower average balances but significantly higher delinquency rates relative to balance size, suggesting debt is more distressing relative to income. Texas and Florida show the highest total debt volumes, driven by population size and high rates of credit card adoption. Among major metros, the New York City metro area, the San Francisco Bay Area, and the Washington D.C. corridor have the highest average balances, but also the highest incomes to service them. The most financially stressed cardholders are often in mid-size metros in the South and Midwest where median incomes are moderate but cost-of-living inflation has outpaced wage growth since 2021.
How Credit Card Interest Is Actually Calculated
Most people assume credit card interest is calculated monthly. It isn't. Your bank calculates interest daily using the formula: daily balance × (APR ÷ 365). That daily charge accrues every day — including weekends and holidays — and compounds into your balance if you carry it. On a $6,500 balance at 22.75% APR, the daily interest charge is approximately $4.05. Over 30 days, that's $121.50 in interest before you've made a single payment. The practical consequence: making your payment a few days early reduces your average daily balance and therefore your monthly interest charge. This is why debt payoff calculators that use APR ÷ 12 (monthly math) underestimate both interest and payoff timeline — sometimes by weeks or months on a multi-year plan. The difference compounds: a 5-year payoff plan run with monthly shortcuts can be off by 2–3 months on the payoff date and $300–600 on total interest.
How Americans Are Getting Out of Credit Card Debt
There is no universal fastest path out of credit card debt, but the data is clear on what works. The Avalanche method — targeting the highest-APR balance first while making minimums on the rest — minimizes total interest paid. On a typical multi-card portfolio, Avalanche saves 15–22% more in interest compared to Snowball (targeting the smallest balance first). The Snowball method, despite costing more mathematically, has measurably higher completion rates in behavioral finance studies, because eliminating small balances early provides psychological momentum that reduces dropout. The Hybrid strategy — targeting one small balance for a quick psychological win, then switching to highest-APR order — attempts to capture both advantages. What all three strategies have in common: they all require knowing your exact balances, APRs, and payoff timelines before you can decide. That starting point — a clear, accurate picture of what you owe and what it's costing you — is what most people are missing.
Methodology
This report synthesizes data from the Federal Reserve Bank of New York, the Consumer Financial Protection Bureau (CFPB), and anonymized aggregate data from the Visentor platform.
Scale your payoff
Add just $150 to your extra payment and see your payoff date move by 2 years.
No spam · Monthly insights · Zero noise
Ready to crush your
credit card debt?
Stop the guesswork. Use our bank-accurate calculators to find your fastest path to freedom. Zero fees. Zero catch.
- Bank-accurate math
- 100% Private & Secure
- No bank login needed
- Free forever
Takes 2 minutes · No sign up
Recommended Resources
Every month you wait costs you interest. Start your free payoff plan today.
Add your cards in 2 minutes, pick a strategy, and get a payoff plan built on the same daily-interest math your bank uses.
- No sign-up required
- No bank login
- 100% Private